
The first ChatGPT sales dashboard looked usable. It had KPI cards, channel filters, two bar charts, and a row exclusion table. It also overstated net sales by $60.
The fictional CSV should have produced $600 in net sales. The generated dashboard displayed $660 because it counted an exact duplicate. Switching to the Store filter gave the correct total, which made the error easier to miss: the duplicate belonged to Online.
This hands-on guide follows that discrepancy from the initial dashboard to the corrected output. The useful result was a working preview with totals that matched an independent calculation after one correction. The files and complete initial prompt below let you reproduce the checks.
How we built the ChatGPT sales dashboard
For this test, we used Harbor Thread, a fictional store with both Store and Online sales. The dataset contained 11 product lines, including an exact duplicate, two unfinished transactions, and two dates outside the selected week. Two legitimate product lines shared order A01.
We pasted the CSV directly into a ChatGPT conversation and asked for one downloadable, self-contained HTML dashboard. The requested output included gross sales, refunds, net sales, included lines, distinct orders, channel and product charts, an All/Store/Online filter, and an exclusion audit. We also requested a replacement-file input and numeric values alongside the charts.
The test took place on October 11, 2026. We used the signed-in ChatGPT web interface and opened its generated HTML preview. This was a small dashboard generated as code; we did not connect ChatGPT to a sales platform, GA4, a database, or a live business feed.
The accounting rules were deliberately narrow: include only Completed lines dated September 28 through October 4, 2026, inclusive; remove exact duplicates across the nine original columns; and keep distinct product lines from the same order. For this fictional exercise, net sales meant gross sales minus refunds attributed to each line. It did not mean profit.
Establish the answer before asking for charts
We calculated the reference totals separately with Python's CSV reader and decimal arithmetic. That gave us something to compare with the generated dashboard rather than treating its output as its own proof.
| Scope | Gross sales | Refunds | Net sales | Included lines | Distinct orders |
|---|---|---|---|---|---|
| All | $660 | $60 | $600 | 6 | 5 |
| Store | $390 | $40 | $350 | 3 | 2 |
| Online | $270 | $20 | $250 | 3 | 3 |
The order count matters here. Removing every repeated order ID would discard a legitimate line from A01. Keeping every row would count the copied L03 line twice. The dashboard needed to distinguish those two situations.
Our earlier ChatGPT weekly sales report covers turning a CSV into a written weekly update. This test asks a different question: do the dashboard's cards, charts, filters, and exclusion audit agree with the source data?
Where the first version went wrong
ChatGPT generated the HTML file and explicitly said it had not opened or interactively tested it. That distinction was helpful: file creation was complete, but validation still belonged to us.
Opening the preview revealed these differences:
| Measure, All filter | Independent reference | First dashboard |
|---|---|---|
| Gross sales | $660 | $740 |
| Refunds | $60 | $80 |
| Net sales | $600 | $660 |
| Included lines | 6 | 7 |
| Distinct orders | 5 | 5 |
The duplicate carried $80 in gross sales and $20 in refunds. Counting it again added $60 to net sales without changing the distinct-order count. That unchanged order count was another reason a quick check could miss the mistake.
The charts repeated the error. Jeans showed $240 in net sales rather than $180, and Online showed $310 rather than $250. The Store filter correctly showed $350 because none of its lines were duplicated. A correct result in one filter did not establish that the whole dashboard was correct.
Inspecting the generated source explained the discrepancy. Each parsed record had an internal __row field identifying its position in the CSV. The code formed its duplicate key with JSON.stringify(r), including that internal field. The two otherwise identical L03 records had different row numbers, so their keys differed.
The exclusion table listed the two status exclusions and two out-of-range dates, but no duplicate. It provided a second visible clue alongside the inflated total.
Correcting the ChatGPT sales dashboard totals
We sent ChatGPT the observed totals, the independently calculated totals, and the cause found in the source. We asked it to use only the nine original CSV columns for duplicate detection and retain __row solely for the audit. We also asked it to preserve both legitimate A01 product lines.
The key part of the follow-up was:
The initial dashboard shows net $660 and 7 included lines.
The correct reference is net $600 and 6 included lines.
Your duplicate key includes __row, so exact copies receive different keys.
Use only the nine original CSV columns for duplicate detection.
Retain __row only for audit and preserve legitimate A01 product lines.
Regenerate the complete HTML file. Do not claim unperformed upload tests.
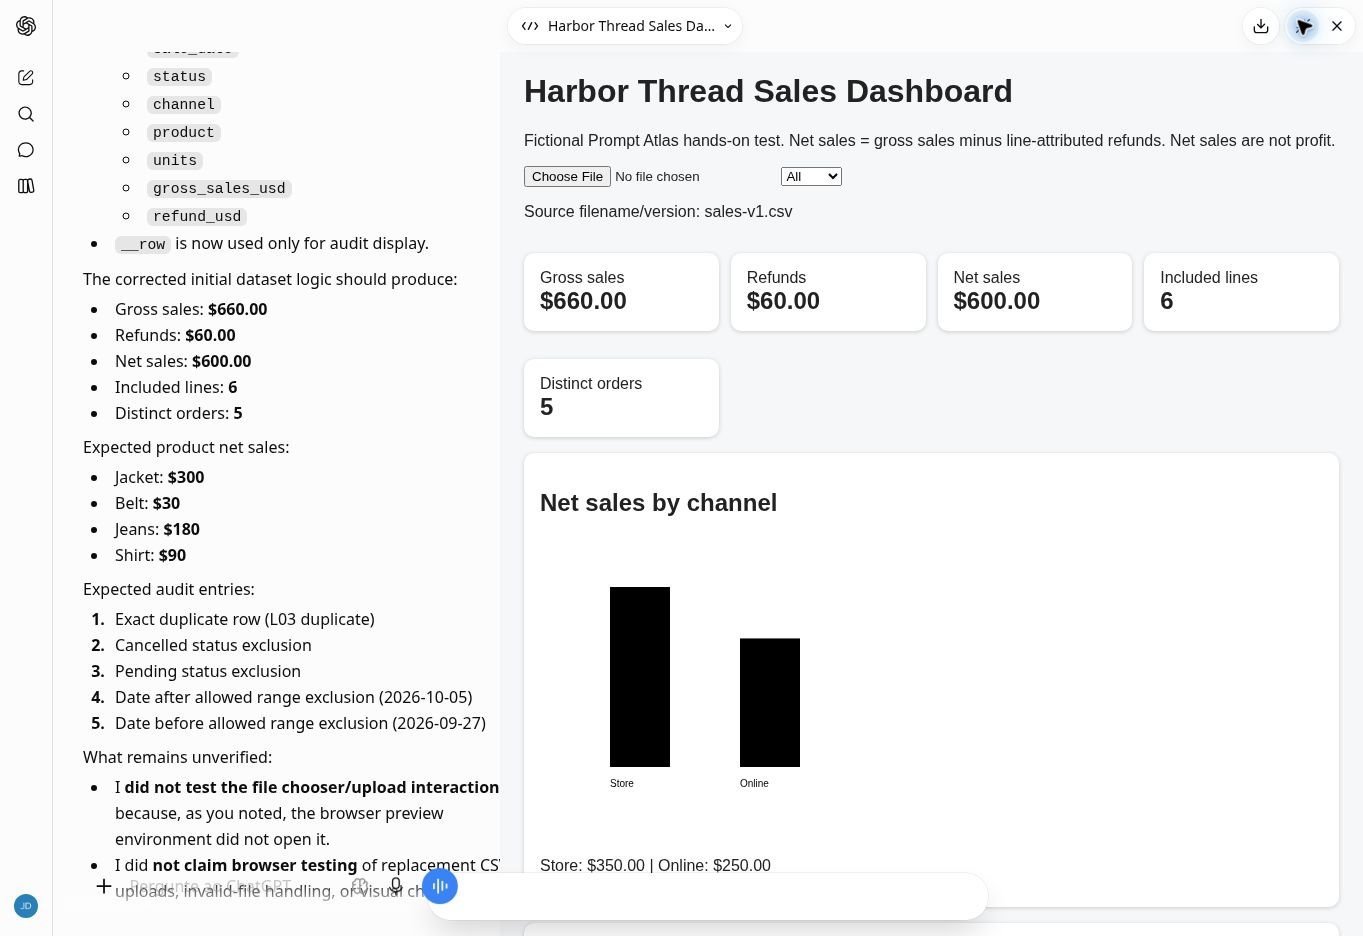
ChatGPT regenerated the file. In the corrected preview, All showed gross sales of $660, refunds of $60, net sales of $600, six included lines, and five distinct orders. Store showed $350 net; Online showed $250 net. Their corresponding gross sales, refunds, line counts, and order counts matched the reference table above.
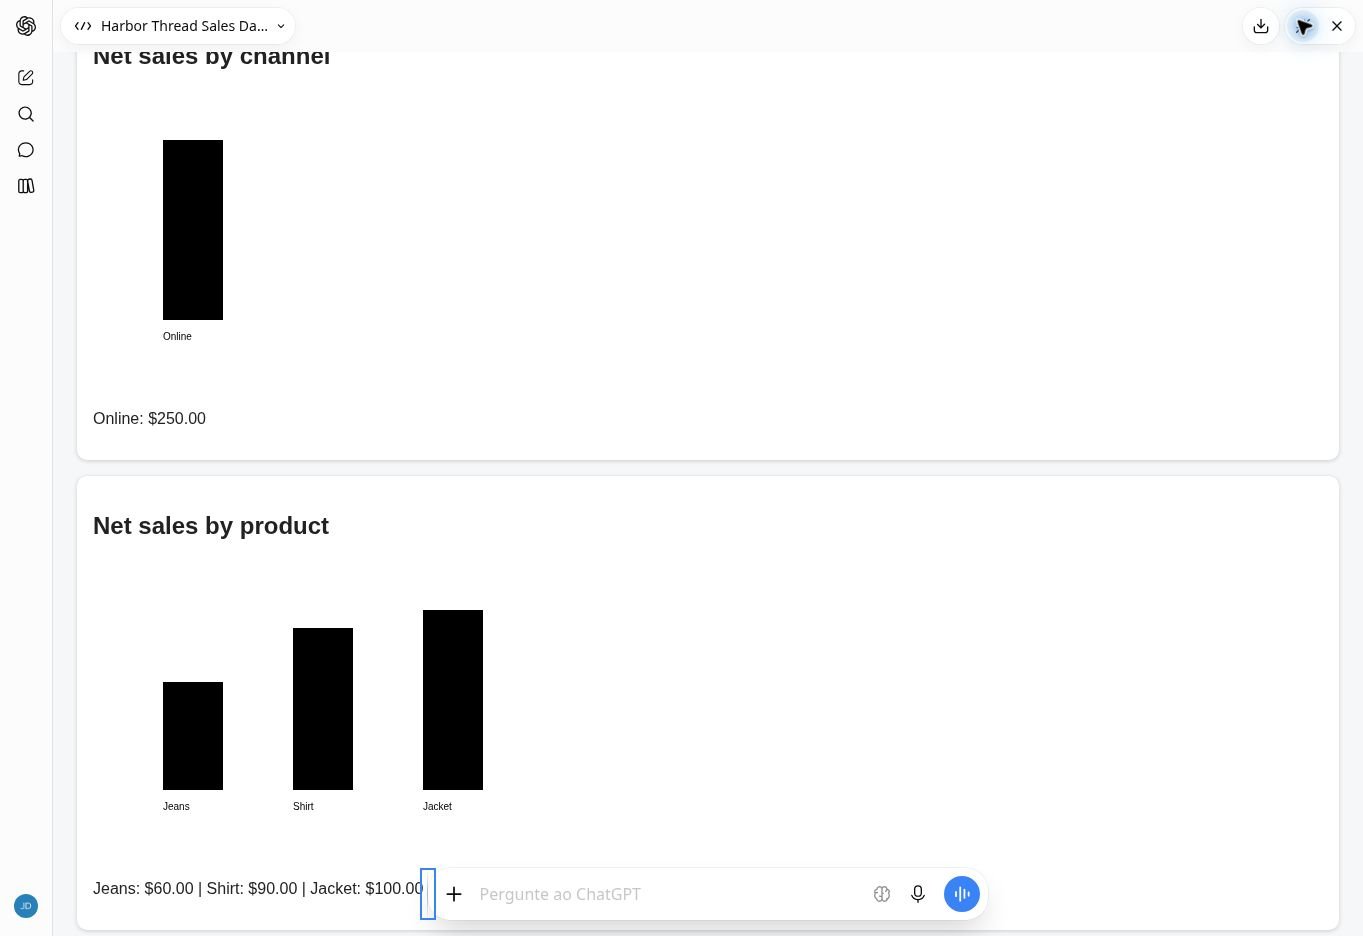
The product values also reconciled: Jacket $300, Belt $30, Jeans $180, and Shirt $90. Both bar charts rendered in the preview, with numeric text available beneath them. The audit now contained five exclusions, including the duplicate at CSV row 6.
Reproduce the CSV checks
Download the fictional source data and the complete prompt used to generate the first dashboard:
- Original Harbor Thread CSV — sales-v1.csv
- Complete initial prompt — TXT
- Test kit — ZIP with all three CSVs, both generated HTML files, prompt, and reference totals
The CSV contains fictional data only. The kit labels the original dashboard’s duplicate-row bug and includes reference totals and the completed local follow-up results.
Read the complete initial prompt and CSV
Respond in English. This is a hands-on Prompt Atlas test with fictional data for Harbor Thread, not a real business. Build a usable interactive sales dashboard from the inline CSV below, as one downloadable self-contained HTML file. Do not just describe a dashboard. It must load a replacement CSV through a file input, show KPI cards (gross sales, refunds, net sales, included lines, distinct orders), charts for net sales by channel and product, and a channel filter (All, Store, Online) that updates every KPI and chart consistently. Display the source filename/version and row exclusion audit. Include accessible numeric values alongside charts. Use the fictional CSV as initial data named sales-v1.csv. No external libraries or network calls. Do not invent profit, causes, or business outcomes. Rules: each row is a product line; remove only exact duplicate copies across ALL columns, keeping the first. Do not deduplicate by order ID; legitimate distinct lines can share an order. Include only Completed lines with sale_date September 28 through October 4, 2026 inclusive. Gross is gross_sales_usd; refunds are refund_usd attributed to the line for this fictional exercise; net = gross minus refunds. Never label net sales as profit. Keep these rules on replacement upload. If a replacement has invalid required values, show an error rather than silently treating them as zero. Show all exclusions with reasons. Do not rely on hard-coded aggregates.

CSV:
line_id,order_id,sale_date,status,channel,product,units,gross_sales_usd,refund_usd
L01,A01,2026-09-28,Completed,Store,Jacket,2,200.00,0.00
L02,A01,2026-09-28,Completed,Store,Belt,1,30.00,0.00
L03,A02,2026-09-29,Completed,Online,Jeans,1,80.00,20.00
L04,A03,2026-09-30,Completed,Online,Shirt,3,90.00,0.00
L03,A02,2026-09-29,Completed,Online,Jeans,1,80.00,20.00
L05,A04,2026-10-01,Cancelled,Store,Jacket,1,100.00,0.00
L06,A05,2026-10-02,Pending,Online,Belt,2,60.00,0.00
L07,A06,2026-10-03,Completed,Store,Jeans,2,160.00,40.00
L08,A07,2026-10-04,Completed,Online,Jacket,1,100.00,0.00
L09,A08,2026-10-05,Completed,Store,Shirt,1,30.00,0.00
L10,A09,2026-09-27,Completed,Online,Belt,1,30.00,0.00

Generate the file and briefly state what has and has not been executed or verified. Do not claim the dashboard was tested unless it actually was.
CSV line breaks are restored from the fixture; the recorded prompt wording is preserved. A new ChatGPT response may produce different code, so use the reference totals rather than expecting the same interface or the same error.
Local upload, invalid-input, and recovery results
We opened corrected-dashboard.html locally and performed three replacement-file checks on October 11, 2026. We documented the local results through copied dashboard output and compared the values with independent CSV reference calculations.
- Valid replacement — matched:
sales-v2.csvproduced $720 gross, $60 refunds, and $660 net, with seven included lines and six orders. Store showed $350 net and Online $310. This file adds one valid Online Belt line with $60 gross sales and no refund. - Invalid input — handled with a caveat:
sales-invalid.csvexcluded CSV row 2 as “Invalid required value.” The remaining totals were $460 gross, $60 refunds, and $400 net, with five lines and five orders. The file was partially processed rather than rejected. It starts from sales-v1.csv, with L01 of order A01 changed from $200 gross and $0 refund to an invalid gross amount. Excluding L01 removed $200 from the valid reference; A01’s separate Belt line remained, so the order count stayed at five. - Recovery — matched: reloading
sales-v2.csvrestored $720 gross, $60 refunds, $660 net, seven lines, and six orders. Product net values matched: Jacket $300, Belt $90, Jeans $180, and Shirt $90. The audit returned to five exclusions: one duplicate, two unfinished transactions, and two out-of-range dates.
Invalid-input caveat: the dashboard did not silently convert not-a-number to zero. It excluded the line and explained why in the audit, but still displayed a partial $400 net total. On visual inspection of the local screen, no warning appeared beside the KPI cards; the only indication was in the exclusion audit. No screenshot of this state is included here. This only partly meets the requested clear-error behavior: a reusable workflow should visibly flag incomplete totals so readers do not mistake them for the full file’s sales.
What to take from this test
ChatGPT produced a dashboard preview and corrected a specific calculation error when given evidence. The first output still needed review: attractive cards and internally consistent charts were all drawing from the same incorrectly included row.
Before trusting a generated dashboard, run this short checklist:
- Include an exact duplicate. Confirm it is removed once and appears in the exclusion audit.
- Include a legitimate repeated order ID. Keep both distinct product lines while counting the order once.
- Check every filter. Reconcile gross sales, refunds, net sales, line counts, and order counts for All and each channel.
- Reconcile cards, charts, and audit. Product and channel values must add up to the cards, with every excluded source row accounted for.
- Replace the file and test invalid input. Verify recalculation, a clear error for a bad amount, and recovery with valid data.
For Harbor Thread, the corrected initial preview passed the totals, filter, and exclusion checks. The local follow-up matched valid replacement and recovery totals, while exposing the partial-total caveat for invalid input. The practical lesson is to establish a reference answer before reviewing the visualization: several polished components can repeat the same underlying error.
Recommended Reading
 AI for Small BusinessChatGPT for Weekly Sales Reports: Checking a CSV Before Using the Numbers
 AI Tool ReviewsTaskade Client Workflow: Checking Saved Records Against a CSV Export
Tool used: ChatGPT. Explore more practical AI guides.




Leave a Reply